
Author: karen
Flow Cytometer detects bacteria in environmental waters


Case Study

The rapid and accurate detection of bacteria in aquatic environments has typically been challenging due to the complexity of the natural water microbial populations. Traditional agar plate methods for analysing aquatic bacteria are subjective and laborious, and rely on being able to adequately culture bacteria.
The good news is, flow cytometers with a high sensitivity of detection provide tools for detecting and analysing microbes independent of their cultivability, as the size, number, nucleic acid content, activity and classification of bacteria can be derived from scattered light and fluorescence signals using flow cytometry. The Agilent NovoCyte flow cytometer can detect very small particles (down to 0.1 µm) with high sensitivity, and so can be applied to various microbial studies by combining multiparameter analytic capability and convenient fluidic maintenance.
In testing the flow cytometer’s capabilities, water samples from multiple environment waters were stained with either SYBR Green I or SYTOX Green I; both are fluorescent dyes which bind to nucleic acids. The instrument was cleaned prior to running samples, filtered buffers were used, and an unstained sample was run to distinguish background noise from fluorescent signal and appropriate scatter and fluorescent thresholding was undertaken.
Using the NovoCyte flow cytometer, the bacteria in natural water could be differentiated into two groups: bacteria of low nucleic acid content (LNA) and of high nucleic acid content (HNA) (Figure 1). It is broadly accepted that HNA is active bacteria, whereas LNA is inactive, dead or a dormant population.

Figure 1: Detection of bacteria in natural waters.
Total bacterial cell counts in multiple environmental waters was also quantified using the NovoCyte flow cytometer (see Table 1). Results demonstrated that natural waters contained the highest bacterial counts of the samples tested and bottled water the lowest. Furthermore, bacterial counts in still water were 10 to 100x higher than that of spring and mountain stream sources.

Table 1: Total cell counts of bacteria in various water samples.
The detection of bacteria in various water samples is essential to maintaining sanitary and healthy drinking conditions, and the NovoCyte flow cytometer can easily and efficiently detect and quantify bacteria in water from several sources. With detection sensitivity coupled to the automatic cell counts measured for each sample, the NovoCyte is an efficient instrument for this application.
Top image credit: iStock.com/stock_colors
This article was initially published in Lab+Life Scientist.
On this page
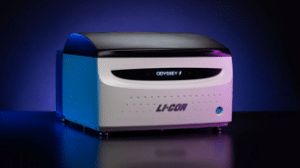
Expand Your Lab’s Imaging Capabilities with the LICORbio Odyssey F Imaging System
Accelerated Imaging with Exceptional Sensitivity and Speed
The LICORbio Odyssey F Imaging System delivers high sensitivity and broad dynamic range with just a click. Available in 3- and 10-channel models, this advanced platform scans samples up to twice as fast as previous generations, supporting a wide array of applications beyond standard qualitative Western blotting. Whether you’re imaging proteins, nucleic acids, or other biomolecules, the Odyssey F accelerates your workflow without compromising data quality.
Dual NIR and Visible Lasers for Advanced Multiplex Imaging
Equipped with dual near-infrared (NIR) lasers, the Odyssey F ensures optimal throughput and quantitation for high-quality imaging. In addition, two visible fluorescence lasers unlock powerful multiplexing capabilities, enabling researchers to explore multiple targets simultaneously in plate-based assays, slide imaging, and beyond. This flexibility makes it ideal for researchers aiming to capture more data from a single experiment
Rapid High-Throughput Imaging with Reproducible Results
Users benefit from rapid scan speeds that reduce total imaging time while improving reproducibility. The Odyssey F is engineered for superior sensitivity and consistent performance, giving researchers increased confidence in their data. Its expanded dynamic range means fewer adjustments and more reliable quantification across a broad concentration spectrum.
Versatile Platform for a Wide Range of Imaging Applications
Designed for versatility, the Odyssey F supports a wide variety of assays and sample types. The expanded focus offset range ensures compatibility with numerous plate formats and sample depths. Whether you’re conducting EMSA/Gel Shift Assays, In-Cell Westerns, Tissue Section Imaging, or Whole Slide Imaging (WSI), the Odyssey F adapts to your lab’s needs, enhancing both productivity and application reach.
Meet Aunty from Unchained Labs: The Fastest, Highest Throughput Protein Stability Characterisation Platform on the planet!
About Aunty
Unchained Labs has raised the bar in biologics characterisation with the launch of Aunty – the world’s fastest and most high-throughput platform for protein stability analysis. Tailored for researchers in biotech, pharma, and gene therapy, Aunty delivers unprecedented speed, sensitivity, and flexibility across a wide range of stability parameters – all from a single 96-well quartz plate.

Why Aunty is a Game-Changer in Protein and Viral Vector Stability Testing
🔬 Comprehensive Stability Profiling — In Minutes
Aunty characterises protein melting (Tm, Tonset), aggregation (Tagg, Tsize), colloidal stability (kD, B22, G22), long-term stability, and viral vector genome ejection, reading a full 96-well plate every minute. With only 8 µL sample per well, it saves valuable material while delivering maximum insight.
💡 Three Technologies. One Platform.
- Full-Spectrum Fluorescence – For intrinsic or dye-based detection of thermal unfolding.
- Static Light Scattering (SLS) – Detects early-stage aggregation with exceptional sensitivity.
- Dynamic Light Scattering (DLS) – Monitors particle size, polydispersity, and colloidal behaviour.
These modalities can be run in parallel or independently, offering complete flexibility to tailor your assay to the molecule at hand.
Explore Aunty’s Core Applications
1. Thermal Ramp Analysis
Track unfolding and aggregation simultaneously using fluorescence and SLS. Aunty’s sensitivity enables detection down to 25 µg/mL, providing reliable Tm and Tagg measurements across formulations, concentrations, and constructs.
2. Protein and Viral Vector Sizing
Aunty’s ISO-compliant DLS covers particles from 0.3 to 1000 nm. Whether you’re working with therapeutic proteins or viral vectors, it delivers high-precision size measurements and polydispersity profiles in seconds.
3. Colloidal Stability
Quantify aggregation risks under different formulations with Aunty’s automated calculation of kD, B22, and G22. This supports developability assessments for high-concentration biologics and formulation transitions (e.g. IV to SC).
4. Capsid and Genome Stability for AAVs
Using SYBR Gold fluorescence, Aunty detects genome ejection temperatures (Tm) in under an hour. It also pinpoints capsid disruption (Tagg) via SLS – essential for viral vector stability profiling.
5. Isothermal Stability Studies
Run long-term thermal stability tests at set temperatures over hours or days. Monitor changes in unfolding or aggregation over time – with sealed wells for sample integrity and minimal instrument occupation.
The Aunty Plate: Quartz Innovation for Precision Science
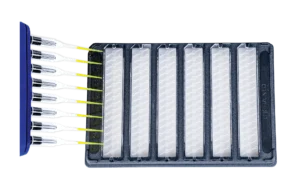
At the heart of Aunty is the first 96-well quartz glass consumable – optimised for superior optical clarity, chemical compatibility, and low-volume use. Automation-friendly and easy to seal, it accelerates workflows and minimises contamination risks.
Fast, Flexible, and Insight-Packed
Aunty’s software simplifies complex workflows with easy setup, real-time monitoring, and intuitive visualisation tools. Whether you’re comparing formulations, screening candidates, or optimising viral vector stability, Aunty delivers actionable results – fast.
Technical Specs at a Glance:
- Sample Volume: 8 µL
- Read Time: 1 minute for 96 samples
- Temperature Range: 15–95°C
- Light Scattering Sensitivity: Down to 0.05 mg/mL (SLS)
- DLS Range: 0.3–1000 nm
- Genome Ejection Sensitivity: ≥5 × 10¹¹ vg/mL
Final Word
Whether you’re optimising a therapeutic antibody, screening excipients, or validating AAV vector stability, Aunty is the gold standard in high-throughput protein and viral vector stability characterisation.
For biotech and pharma researchers looking to speed up developability, reduce material usage, and gain multi-parameter insight in a single run – Aunty is the instrument you’ve been waiting for.
ProPure™ Endotoxin-Free Recombinant Proteins
Introducing ProPure™
Endotoxins – lipopolysaccharides derived from Gram-negative bacteria – can trigger immune responses that compromise experimental accuracy, particularly in cell-based and in vivo studies. Sino Biological’s ProPure™ Endotoxin-Free Recombinant Proteins are produced under animal-free conditions using a proprietary purification workflow that delivers exceptionally low endotoxin levels (<0.1 EU/μg). Designed to meet the stringent demands of immunology, inflammation, and preclinical research, ProPure proteins provide confidence in experimental results by reducing background immune activation and ensuring reproducible data.

Why Endotoxin Contamination Matters
Endotoxin contamination is a hidden but significant variable in biological research. Even trace amounts can lead to false-positive immune responses in assays or alter cytokine production in cell models. Traditional recombinant protein expression systems, particularly those using E. coli, often yield proteins contaminated with endotoxin residues, making additional purification essential before sensitive applications.
Introducing Sino Biological’s ProPure™ Solution
Sino Biological’s ProPure™ line was developed to address this critical challenge. Through an advanced combination of expression system optimisation, multi-step purification, and endotoxin removal, ProPure proteins achieve endotoxin levels below 0.1 EU/μg—surpassing industry standards. This makes them particularly well-suited for applications such as:
- In vivo animal studies requiring endotoxin-free reagents
- Cell stimulation and activation assays where innate immune pathways are measured
- CAR-T, vaccine, and antibody development research
- Inflammation and immunology studies sensitive to TLR activation
Animal-Free Production and Reliable Activity
All ProPure proteins are animal-free, removing variability associated with serum-derived materials. The streamlined production process also retains native protein conformation and biological activity – critical for achieving consistent results across experiments.
Compared to standard recombinant proteins, ProPure reagents minimise background cytokine induction and non-specific immune activation, helping researchers distinguish true biological responses from endotoxin artefacts. By ensuring reproducibility and reliability, these proteins support high-quality data generation in translational and preclinical research environments.
Supporting Reproducibility and Regulatory Confidence
With growing emphasis on data integrity and regulatory compliance, ProPure™ Endotoxin-Free Proteins represent a valuable upgrade for any lab working with immune cells, organoids, or animal models. Their consistent low-endotoxin profile helps meet the rigorous standards required for translational and preclinical workflows.
Conclusion
When precision matters, ProPure™ Endotoxin-Free Recombinant Proteins provide unmatched purity and performance. By eliminating one of the most common sources of experimental variability, researchers can trust that their immune-related findings reflect biology – not contamination.
Unleashing Spectral Power: Agilent NovoCyte Opteon Arrives in ANZ
A Joe Blogs post by Joe Roberts, PhD
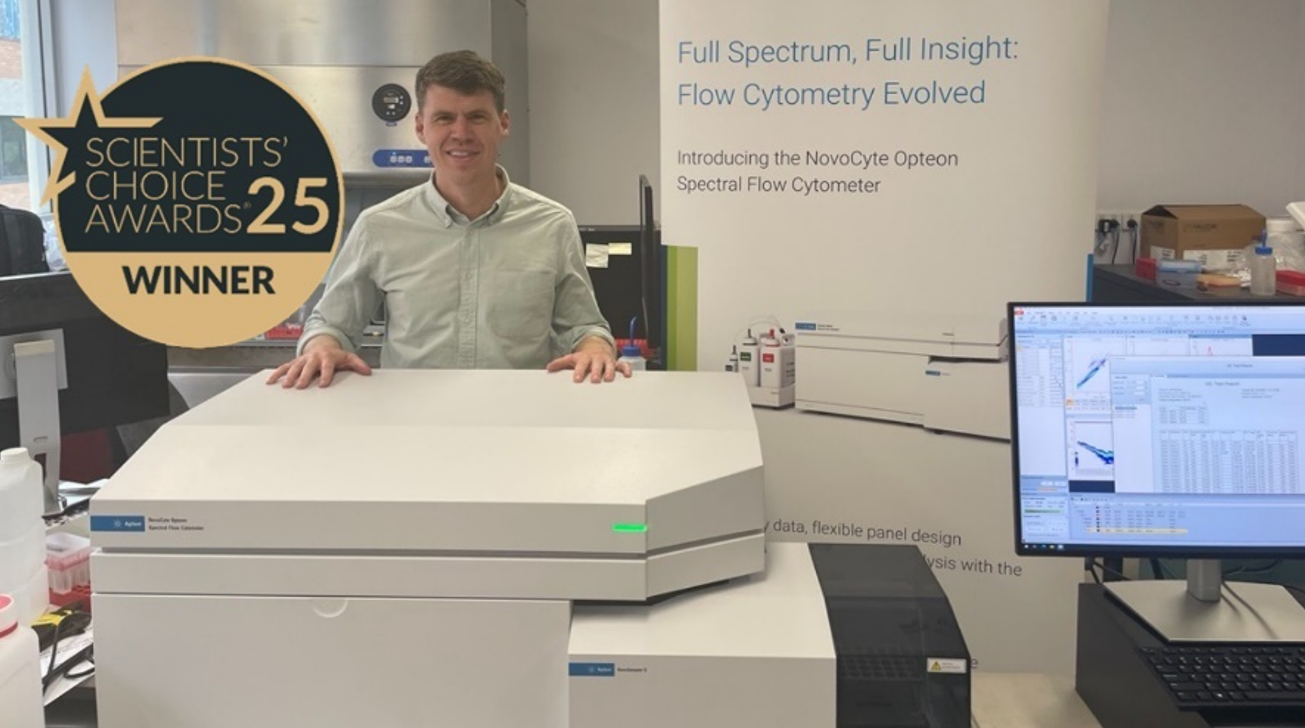
Spectral flow cytometry continues to transform single-cell research – and now, for the first time, laboratories in Australia and New Zealand can experience the Agilent NovoCyte Opteon first hand.
Launched globally at CYTO 2024, the NovoCyte Opteon has already earned international recognition, taking home the Select Science Scientist’s Choice Award for “Best New Drug Discovery & Development Product of 2024.” With up to five lasers, 73 detectors, and cutting-edge optical engineering, this system represents the next generation of high-dimensional cytometry – and it’s now available for demo in ANZ.
Spectral acquisition, redefined
Unlike conventional cytometry, the NovoCyte Opteon captures the full emission spectra of each fluorochrome across all lasers. This approach allows for greater panel flexibility, more accurate unmixing, and cleaner resolution of overlapping signals – ideal for complex immunophenotyping studies.
Spectral Flow Cytometry vs Conventional Flow: What’s the Difference?
Traditional flow cytometry detects fluorescence using individual optical filters for each fluorochrome, limiting panel size and often causing signal overlap.
Spectral flow cytometry – like the Agilent NovoCyte Opteon – captures the entire emission spectrum from every fluorochrome across all lasers.
This enables:
-
Greater panel flexibility with more markers in a single run
-
Improved accuracy through spectral unmixing of overlapping signals
-
Cleaner data by accounting for autofluorescence as a separate spectral component
The result is a more powerful, precise, and reproducible analysis – ideal for complex immunophenotyping and high-dimensional research.
Configurability and Optics
Researchers can choose 3-, 4-, or 5-laser configurations, with the flagship system spanning UV, Violet, Blue, Yellow/Green, and Red lasers – and up to 73 detectors. Agilent’s proprietary optics and electronics maximise sensitivity and spectral separation, ensuring high-quality data.
Dynamic Range, Small-Particle Detection, and Autofluorescence Handling
It boasts a wide dynamic range both for fluorescence and scatter (size) detection, reducing the need for frequent detector adjustments.
Dual-laser small particle detection (using 405 nm and 488 nm SSC) enables detection of particles down to ~80 nm without needing separate adjustments between cell and particle modes.
Also, the instrument supports autofluorescence subtraction (i.e. treating autofluorescence as a spectral component), which helps resolve dim populations more clearly.
Reliability and Stability Built In
To maintain performance in variable lab environments, the NovoCyte Opteon integrates on-board temperature control, fluidics monitoring, electronics sensor circuits, and real-time instrument status feedback.
Automation and Throughput
It’s compatible with the NovoSampler S, accepting 40-tube racks and microplates (384/96/48/24), and is ready for robotic automation. Calibration is automated, with templates for labware types saved for reproducibility. Carryover is minimal (< 0.1 %) via rinse cycles.
Software and Workflows
Agilent’s NovoExpress (Opteon) software version 2.0+ underpins the acquisition, unmixing, analysis, and reporting workflow. They’ve enhanced the user interface with an “unmixing” tab, streamlining spectral unmixing steps. The software supports both real-time acquisition and downstream “offline” analyses.
Joe’s Takeaway
The arrival of the Agilent NovoCyte Opteon in the ANZ region marks a real milestone for spectral flow cytometry. Local researchers now have access to one of the most advanced, award-winning platforms available – combining powerful optics, automation readiness, and Agilent’s renowned reliability, all supported locally by Millennium Science.
If you’re interested in demoing the award-winning NovoCyte Opteon Spectral Flow Cytometer, we’d love to hear from you. Reach out to arrange a hands-on session and see what spectral flow can really do for your research.
And if you’re attending CYTO-Connect (Perth, November 27-29, 2025), come and say hello – we’ll be there showcasing the Opteon and chatting all things spectral!
If you’re interested in a demo of the Opteon, contact us today!
Until next time… happy experimenting!

On this page
- A Joe Blogs post by Joe Roberts, PhD
- Spectral acquisition, redefined
- Spectral Flow Cytometry vs Conventional Flow: What’s the Difference?
- Configurability and Optics
- Dynamic Range, Small-Particle Detection, and Autofluorescence Handling
- Reliability and Stability Built In
- Automation and Throughput
- Software and Workflows
- Joe’s Takeaway
Unlocking the Power of Spatial Biology with the Right Antibody Choices
Secondary Antibody Selection for Spatial Biology
Spatial biology is transforming the way we understand biological systems. By integrating spatial information into research, it provides a holistic view of how cells and molecules interact within their native environment. This approach sheds light on the complex interplay between cellular and molecular components, offering deeper insights into the function and behaviour of living organisms.
To achieve reliable and reproducible results in spatial biology, careful antibody selection is essential. Here are some key considerations:
Consider Host and Target Species
Secondary antibody selection begins with species. The host of your secondary must differ from both the tissue species and the host of the primary antibody. For example, when using a rabbit primary antibody on human tissue, a goat anti-rabbit secondary is preferred. This reduces background interference and ensures the signal reflects true binding rather than cross-reactivity..
Match Secondary to Primary Class
Not all primary antibodies are the same. Polyclonal IgGs require anti-IgG secondaries, while monoclonal IgMs need anti-IgM secondaries. For monoclonal IgG subclasses (such as IgG1), it is best practice to use subclass-specific secondaries (anti-IgG1) for maximum accuracy. This level of matching safeguards against nonspecific binding and strengthens reproducibility.
Affinity-Purified: Cut the Noise
Affinity purification ensures secondaries recognise their targets with high specificity. By removing unwanted immunoglobulins, affinity-purified antibodies deliver clearer signals and consistent results – especially when detecting low-abundance proteins. The result: less noise, less background, and greater confidence in your data.
Cross-Adsorbed for Multiplexing
Spatial biology thrives on multiplexing, but multiple species and fluorophores introduce complexity. Cross-adsorbed antibodies are refined to remove cross-reactive components, lowering background and minimising false positives. This makes them ideal for multi-label experiments where precision is paramount.
Choose the Right Fluorophores
Signal clarity depends on the brightness and stability of your fluorophores. Rockland offers a wide range of conjugates, including DyLight™, Cy™, and FITC dyes. These high-performance labels are particularly powerful for detecting low-expression targets, ensuring that no signal is missed in complex tissue environments.
A Case in Point: Neural Crest Imaging
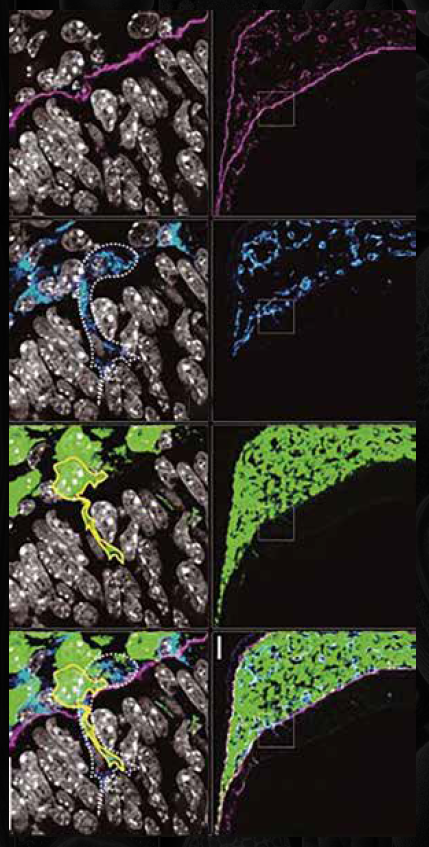
In one example, Rockland’s DyLight™ 649-conjugated goat anti-rat secondary antibodies were used to visualise neural crest-derived cells infiltrating the brain region of a mouse embryo. The result was a sharp, specific signal that allowed researchers to trace cell migration and interactions in detail. This illustrates the impact that well-chosen secondary antibodies can have on spatial imaging outcomes.
Conclusion
When it comes to spatial biology, success is in the details. Rockland’s secondary antibodies – affinity-purified, cross-adsorbed, and conjugated to high-performance fluorophores – provide the specificity and sensitivity needed for reproducible results.
Real-Time Cell Insights with Agilent xCELLigence RTCA eSight
A Joe Blogs post by Joe Roberts, PhD
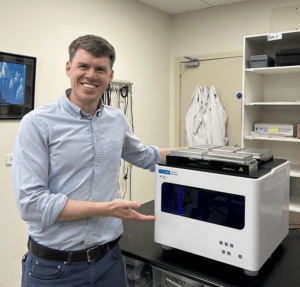
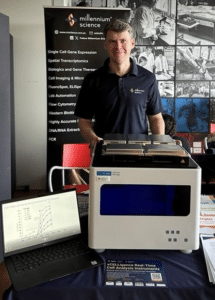
Cells don’t stand still, so why should your assays? The Agilent xCELLigence RTCA eSight™ goes beyond snapshots, revealing real-time cell behaviour with label-free impedance and live imaging.
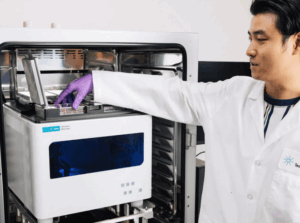
By pairing biosensor impedance technology with live-cell imaging, eSight enables researchers to monitor cell health, function, and behaviour simultaneously, continuously, and in real time. It’s not just more data, it’s deeper, more meaningful insight into what your cells are really doing.
How Real Time Cell Analysis (RTCA) Technology Works
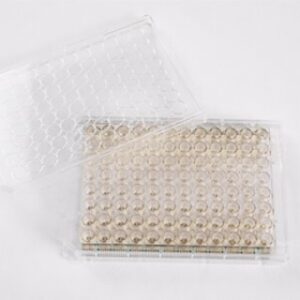
At the heart of RTCA eSight are proprietary E-Plates, embedded with gold biosensors. These electrodes non-invasively measure impedance, which reflects cell metrics such as:
- Proliferation
- Adhesion strength
- Morphological changes
- Migration and differentiation
Because impedance is recorded continuously, you capture events as they happen, in seconds, minutes, hours, or days, without disturbing the cells. The temporal resolution is exquisite, allowing you to see subtle shifts long before they’re visible under a microscope.
Multi-Modal Cell Analysis: Impedance Meets Live-Cell Imaging
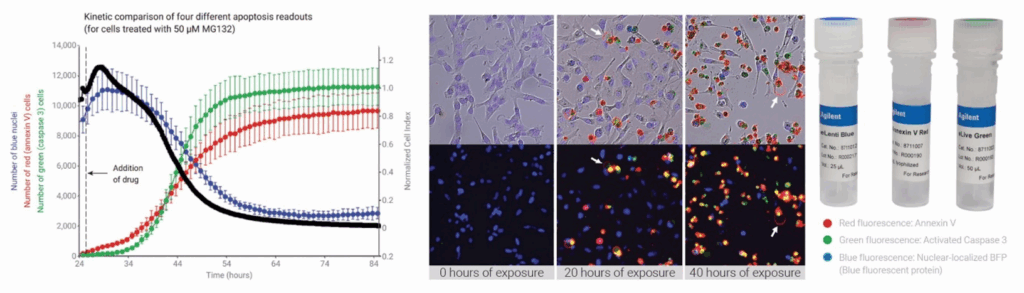
In concert with impedance, eSight’s imaging module provides brightfield plus three fluorescence channels (red, green, blue). This lets you visualise your cells directly while validating and enriching the kinetic impedance data.
The result is a spatial and temporal view of cell populations at an unprecedented level of detail, ideal for assays like proliferation, cytotoxicity, and apoptosis. And importantly, impedance and imaging are performed on the same cells, not replicate wells, so your data are directly correlated.
Streamlined RTCA Workflow
One setup, two data streams. Here’s how simple it is:
- Seed your cells into an E-Plate.
- Insert the plate into eSight (inside your incubator).
- Define your assay in the RTCA software.
From there, impedance and imaging data are captured automatically, then integrated into a single timeline for straightforward analysis. The software even supports outputs like:
- RTCA images
- KT50 (time to 50% cytolysis at a given effector-to-target ratio)
- % Cytolysis dose response curves
- IC50 calculations
No juggling between platforms – just a unified dataset ready for export.
Applications Across the Board
Researchers are already applying RTCA eSight to:
- Immune-cell killing assays – track cytolysis in real time with kinetic precision.
- Virology – Screening and characterizing antiviral drugs in real time
- Proliferation and apoptosis studies – capture early events, validate with imaging, and overlay with fluorescent markers.
- Cell heterogeneity analysis – reveal subpopulation responses that would be lost in averaged data.

Joe’s Takeaway
The Agilent xCELLigence RTCA eSight is more than the sum of its parts. By integrating patented biosensor impedance with live-cell imaging, it delivers:
- Continuous, label-free monitoring of cell health and function
- Brightfield and Three-colour live-cell imaging for direct visual validation
- Unified kinetic datasets from the same cell population
- Broad versatility across immuno-oncology, virology, and general cell biology
For researchers who want to move beyond static snapshots, eSight offers a powerful new way to see biology unfold in real time, with the reproducibility, temporal resolution, and ease-of-use that modern labs demand.
If you’re interested in a demo of the eSight, contact us today!
Until next time… happy experimenting!
Introducing Atlas™: The Next Era of Cell Imaging
Better data. Faster breakthroughs. Confident choices.
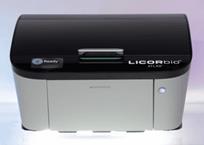
LICORbio’s new Atlas™ Imager is redefining cell imaging for life science researchers across Australia and New Zealand. Built for both 2D and 3D assays, Atlas combines speed, scale, and clarity in a single, easy-to-use platform – empowering scientists to accelerate discoveries in drug development, translational research, and beyond.
Smarter, Faster, Scalable Imaging
Unlike traditional systems that require manual stitching or time-consuming illumination corrections, Atlas is engineered to deliver whole-plate imaging in less than one minute. Its patented line-scanning optical system minimises background fluorescence, boosts sensitivity, and enhances multiplexing capabilities – critical for high-throughput screening and complex cell-based assays.
Key advantages of the LICORbio Atlas
- High throughput – Acquire entire well plates rapidly or zoom into single wells with up to 5µm resolution.
- Broad applications – Capture cell viability, luminescence, and multiplex fluorescence data in one instrument.
- Deep 3D imaging – Confidently image spheroids, organoids, organ-on-a-chip models, and other microphysiological systems.
- Ease of use – Streamlined workflows reduce manual steps and consolidate multiple instruments into one solution.
- Cost-effective – Higher-content imaging without the high price tag of competitive systems.

Designed for Today’s Translational Research
From monitoring cell culture to high-resolution plate and well scanning, Atlas provides reliable, reproducible, and quantitative results with minimal hands-on time. With over 30 imaging channels spanning UV to near-infrared, researchers gain unmatched flexibility for diverse applications – from drug screening to advanced tissue modelling.
By eliminating inefficiencies and post-processing steps, Atlas lets you focus on what matters most: generating insights that move science forward.
Why Atlas Stands Out
- Whole-plate scans in under one minute
- Z-stack multiplex fluorescence for 3D studies
- Built-in luminescent imager
- Over 30 imaging channels with six lasers plus RGB LED
- End-to-end solution for cell-based assays
Accelerate Your Next Discovery
Whether you’re developing new therapeutics, studying disease models, or advancing organoid research, Atlas is the balanced solution for speed, sensitivity, and scalability in cell imaging.
Antibody Arrays Explained: A Guide to Multiplex Protein Profiling
Introduction
A microarray is an assay that allows the simultaneous detection of multiple molecules – such as nucleic acids, peptides, proteins, or antibodies – within a small surface area. For example, thousands of molecules can be analysed on a standard glass slide (75 mm × 25 mm). Microarrays provide researchers and clinicians with a broad snapshot of biological processes at a given time.
One common type of microarray for protein analysis is the antibody array. Compared to traditional “single-plex” assays, such as ELISAs that analyse one protein at a time, antibody arrays are more cost-effective, require minimal sample volume, and enable multiplex protein detection. This blog explores the different antibody array formats, how they work, and considerations for choosing the right format for your research.

How Antibody Arrays Work
Step 1: Immobilise Capture Antibodies onto Substrates
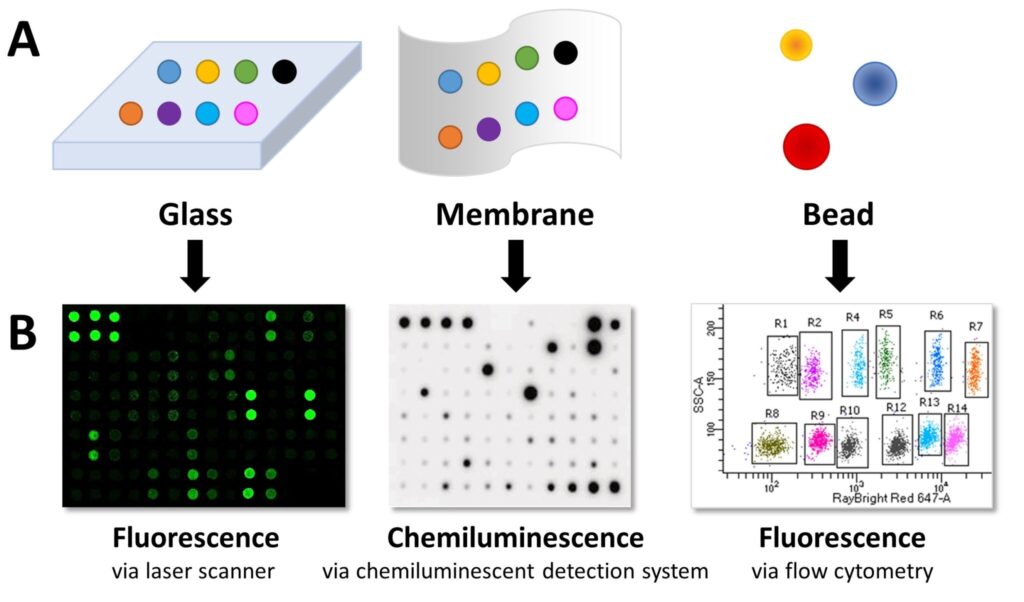
Capture antibodies are immobilised on solid substrates such as glass slides, membranes, or microbeads.
- Planar surface arrays: Capture antibodies with known specificities are spotted on a slide or nitrocellulose membrane in an addressable format.
- Bead-based arrays: Capture antibodies are bound to beads of varying sizes and fluorescent properties. Each bead’s characteristics indicate the target protein.
Step 2: Block the Array
Before sample incubation, the array is blocked to prevent non-specific binding. Protein-based blockers such as BSA or non-fat milk, often with a detergent (e.g., 1% Tween-20), reduce background noise and improve data accuracy.
Step 3: Add Samples and Detection Antibodies
During incubation, capture antibodies bind their target proteins. Unbound proteins are removed via washing.
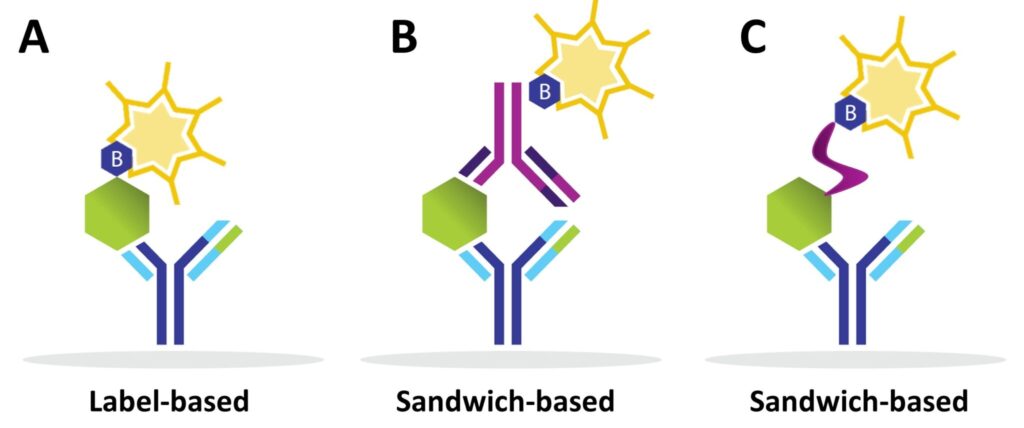
- Label-based arrays: Proteins are pre-labelled with biotin before incubation.
- Sandwich-based arrays: Biotinylated detection antibodies are added after sample incubation, creating a “sandwich” with the target protein.
Alternative approaches, such as using a biotinylated lectin to detect glycosylated proteins, can also be employed.
Step 4: Detect Proteins via Chemiluminescence or Fluorescence
A streptavidin molecule conjugated to a fluorophore or horseradish peroxidase (HRP) binds to biotin. Detection is then achieved using:
- Chemiluminescence: HRP substrate produces light, measured via CCD camera, X-ray film, or gel documentation system.
- Fluorescence: Fluorophores are detected with laser scanners for glass slides or flow cytometry for bead-based arrays.
Qualitative, Semi-Quantitative & Quantitative Data
Antibody arrays can generate:
- Qualitative data: Visual inspection of signal intensity.
- Semi-quantitative data: Fluorescent or chemiluminescent outputs with relative expression differences (fold changes).
- Quantitative data: Data compared against a standard curve to determine exact protein concentrations.
Volume Requirements
Sample volume depends on the substrate, array design, and sample dilution:
- Sample dilution: At least 2-fold to minimise “sample matrix effects” (SMEs) that can block antibody binding.
- Protein concentration: For non-serum samples, aim for ≥1 mg/mL (ideally >2 mg/mL) for stronger signal.
- Sample handling: Membrane-based arrays require more sample than glass or bead arrays but are easy to handle and have low background noise.
Difference between Label-based and Sandwich Antibody Arrays
Label-based Arrays
- One antibody per protein (capture antibody).
- High-density arrays possible (up to 6,000 human proteins).
- Low sample volume required; semi-quantitative data.
- Best for biomarker discovery.
Sandwich-based Arrays
- Two antibodies per protein for higher specificity.
- Available on membrane, bead, and glass substrates.
- Provide semi-quantitative and quantitative data.
- Ideal for clinical trials and biomarker validation.
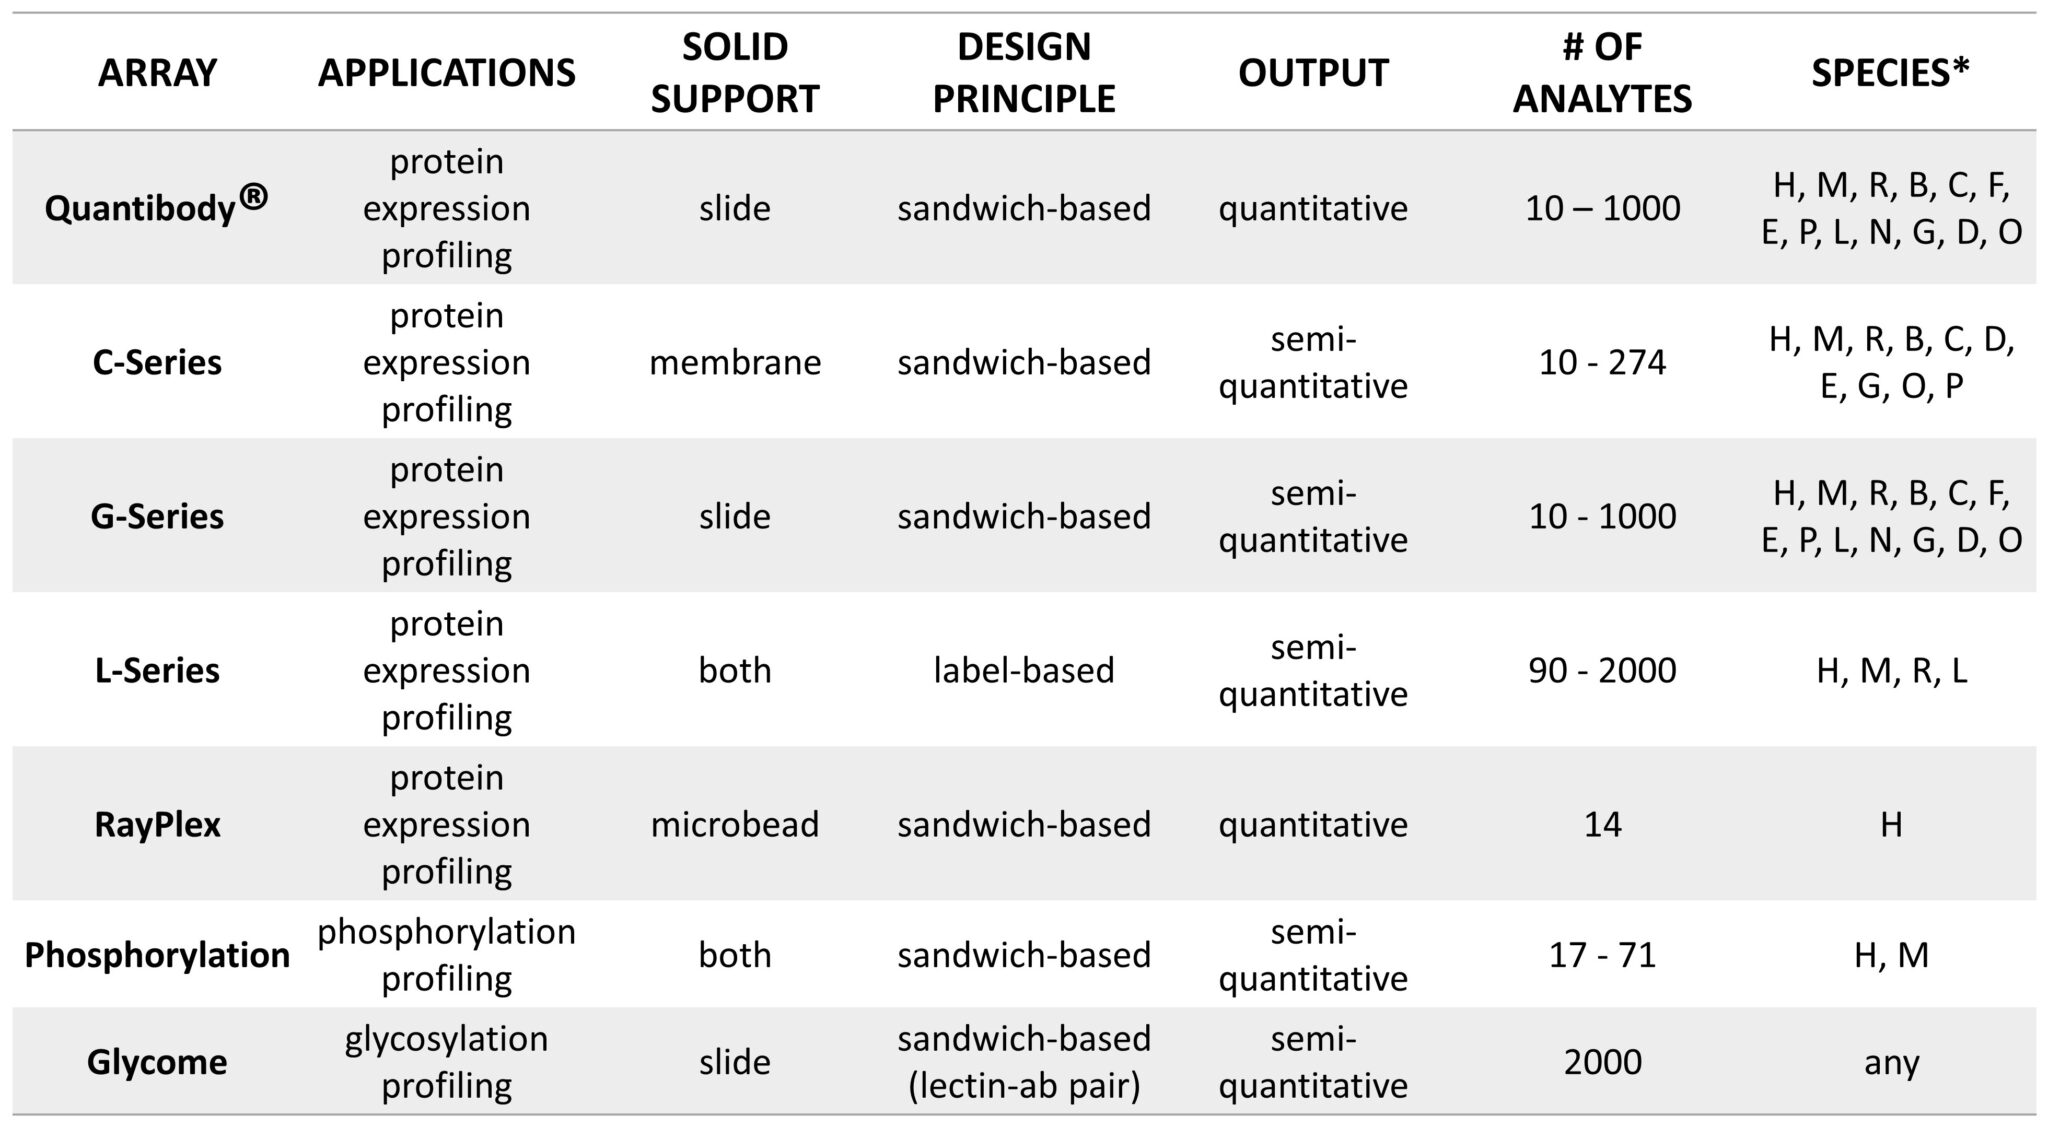
A Comparison of Label-based and Sandwich-based Antibody Arrays
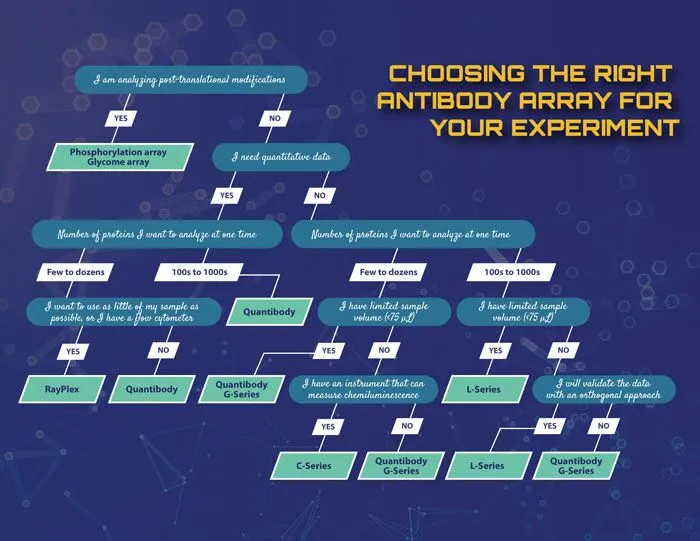
Decision tree to help choose the appropriate antibody array for the experiment.
Conclusion
Antibody arrays are a powerful tool for multiplex protein detection and profiling. High-density arrays are ideal for large-scale biomarker discovery, while smaller panels can focus on specific pathways such as inflammation, angiogenesis, or growth factors. Customisable panels and full testing services are available, making these arrays accessible even for laboratories with limited resources.